Where is the moment control is lost?
Start with what must stay under control
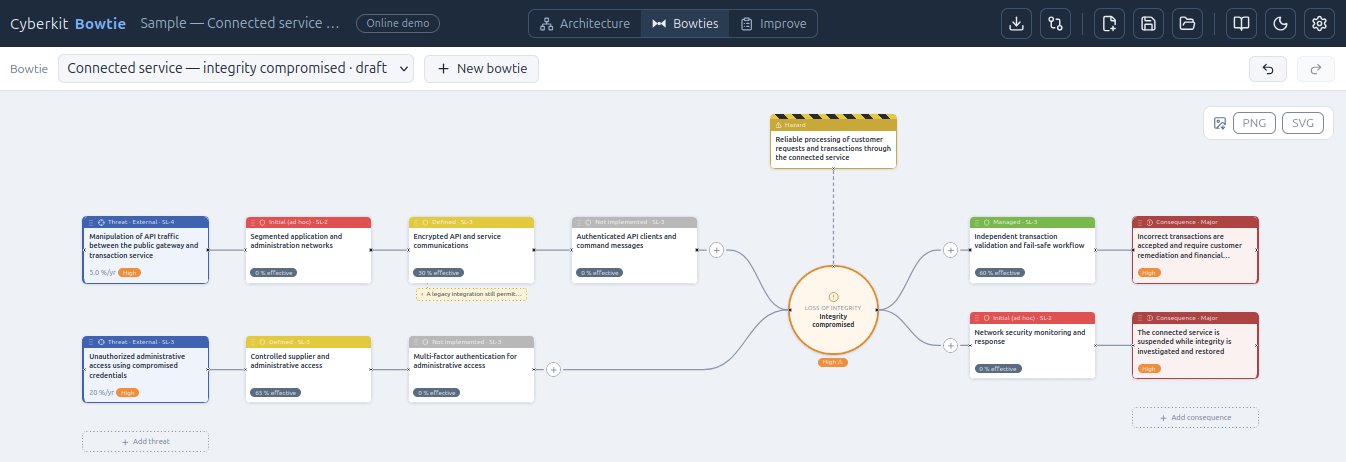
The hazard is the valuable system or capability. The top event is the precise moment control is lost—before the damage occurs.
Cyberkit Bowtie guides you through the established bowtie methodology—from understanding how threats, barriers and consequences connect to acting on the improvements that matter most. Learn through the website, then use the tooling to apply the method to your own risk stories.
Trace causesConnect credible threats to the event.
Test barriersShow strength, condition and evidence.
See consequencesMake operational impact concrete.
Risk analysisAssess likelihood and impact before and after action.
Compare actionsFocus effort where it changes risk.
Why bowtie helps
Cyber risk crosses technology, people and process. A bowtie gives engineers, operators, risk owners and managers one scenario to challenge together: how control can be lost, what prevents it, what limits the consequences and where an intervention changes the path.
A bowtie makes the entire risk path visible at once—and makes weak assumptions difficult to hide.
The established bowtie method
Build one risk story in six moves—from the moment control is lost outward to threats, barriers, consequences and action. The left side asks which preventive barriers can stop that loss; the right asks which recovery barriers can keep it from becoming harm.
Walk through the six steps below to understand the methodology in practice.
Where is the moment control is lost?
The hazard is the valuable system or capability. The top event is the precise moment control is lost—before the damage occurs.
What could cause that loss of control?
Threats sit on the left: malicious actions, insider mistakes or environmental events that could cause the top event.
What can stop each threat?
Every preventive barrier the threat must cross becomes visible. Independence matters: one failure should not make the next layer fail automatically.
What limits damage after control is lost?
On the right, recovery barriers limit what happens after control is lost—then consequences make the business impact concrete.
How strong is the path—and what would change it?
Use demonstrated maturity to estimate each path and place its current risk in the risk matrix. Then test one improvement at a time and compare the current risk with the expected risk after the change.
Which improvement should move forward?
Compare improvements by risk reduction and reach, then take the strongest next step. The model keeps each action connected to the path—and the assumptions—it is meant to change.
Beyond the diagram
The model becomes useful when its numbers, control claims and dependencies can be explained—not merely displayed.
frequency × impact
Follow one credible cause through barriers to one consequence. Every input remains available for challenge.
How the numbers work →02strength × maturity
A technically capable control can still be weak when ownership, evidence, testing or day-to-day operation is immature.
Understand maturity →03one measure → many paths
Shared barriers and chained bowties show where one change reduces risk across more than one system or scenario.
See portfolio effects →Put the method to work
Start with a bounded system, build only credible paths, expose the assumptions and compare improvements. The software keeps that thread connected.
Identify supporting assets, interfaces, zones and the assessment boundary.
Describe threats, top events, consequences and independent barriers.
Assess frequency, impact, inherent strength, maturity and residual risk.
Compare changes by expected risk reduction and reach, then use the evidence behind those estimates to guide attention and budget.
Open knowledge library
Ten practical guides explain the diagram, calculations, maturity, architecture and modelling choices behind Cyberkit Bowtie.
Browse all guidesWhat the diagram shows, how to follow one cyber-risk path, and what to question when a layer looks too reassuring.
A practical explanation of LOPA-style path likelihood, barrier effectiveness, impact and the limits of numerical precision.
Why a technically strong measure can remain a weak barrier until process, ownership, evidence and testing make it dependable.
Defaults, conservative choices and modelling shortcuts that must remain visible before anyone treats the output as a decision.